Leveraging Shiny for creating high-end bespoke parameterised plots (without learning how to code)
A behind-the-scenes look at an app I developed to allow a client who doesn’t code to create parameterised visualisations straight from his data.
Building an app to allow Gavin to create visualisations without needing to learn R was a really exciting project. He gets consistently formatted data from his clients that he was wrangling in Excel before translating to powerpoint to allow him to use the branded data interpretation grid he helped his clients engage with the patterns he was finding.
What if we could do all this at the press of a button? Could we make it look as good, or even better than the original, and could we run it locally to avoid any of the risk associated with uploading confidential data to an online platform?
Recording
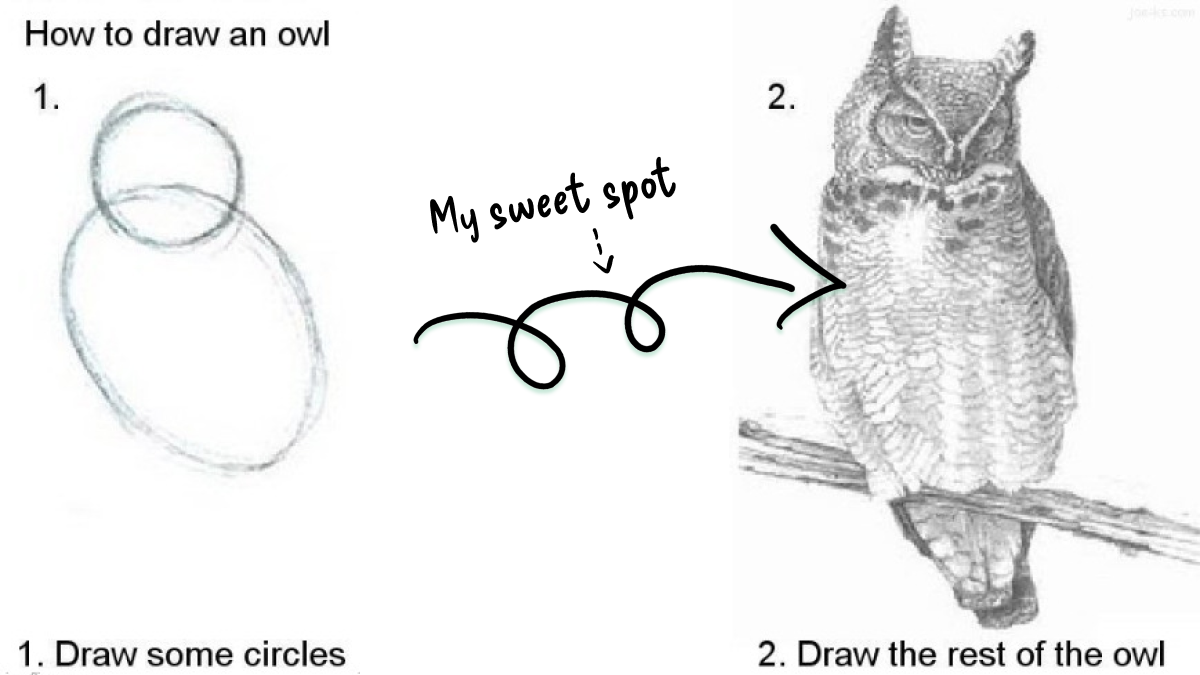
As I’ve reflected on this talk, I’ve come to realise that there was an unintentional bit of that “how to draw an owl” meme - in my enthusiasm for the Shiny app, I skipped over the part that allows people to actually implement the parameterisation.
Here’s an attempt to redeem myself, by sharing a talk I gave on just that at the RMedicine conference the same year.
I’ll be revisiting that topic in a 3-hour workshop this summer, in what I’ve identified as my workshop sweet spot - watch this space!